Friday, March 7, 2008

The Geography Behind Climate Change


The figure is showing representative countries for StoraEnso's sales market. 15000 individuals responded to the question; “have you personally done anything to reduce the usage of packaging and bags”


How climate change affects end customers varies from country to country. By studying surveys from HSBC, Accenture, BBC and McKinsey we found that there is some countries and continents that are more representative for the emerging changes in end customer demand and behavior. The map below shows countries that are leading the green wave and are strategic key markets for StoraEnso, like Russia, India, Brazil and China. These countries are further interesting due to the supply of low cost and fast growing fiber. A key finding is that these countries are showing a considerable environmental awareness compared to more developed countries.


The figure is showing representative countries for the StoraEnsos sales market. 15000 responded to
the question; “are you buying any green products?”


Tuesday, March 4, 2008

Are we all on the same track?

The McKinsey survey "How companies think about climate change" shows result that are very similar to the HSBC survey "Climate Confidence Index 2007" with one big deferens, it’s not the peoples opinion it’s the CEO’s opinion. Accenture’s survey "A new consumer mindset" also confirms the similarities and so dose the Landors annually "ImagePower" survey.

Similarity One
Growing GDP equals Growing climate awareness

McKinsey survey: “Role of climate change in overall corporate strategy considered very, somewhat important”

Accenture and HSBC found the same result; the most concerned and active countries are the merging as India, China and Brazil. The least concerned in HSBC and Accenture survey is United Kingdom and North America.

Similarity two
It’s changing and that’s rapidly

McKinsey survey: “How often does your company currently take climate change into consideration?”

65% answered - Managing corporate reputation, brands

Landor's "ImagePower" survey shows similar and very interesting result; in the 2006’s survey they found that green thinking was a minority concern and that few could name “a green brand”. But in the 2007’s survey they record a striking change, a united green concern through out their answers.

Environmental "Supplier Keiretsu"

Keiretsu is another Japanese expression to put on the list of production vocabulary influenced by Toyota and Honda. The reason for another tongue wrecking Japanese word is the success for Japanese enterprises to built strong relationships with its suppliers. But first some about why strong relationship could be useful when launching corporate carbon strategies.

Hoffman tells an eight-step-story in his book “Carbon Strategies” where a supply chain perspective is very important in order to assess a company’s risks and opportunities with climate change. Hoffman states that interaction with suppliers and buyers are important to increase the value chain’s environmental performances. Michael Knemeyer and Douglas M. Lambert, both working at Ohio State University’s Fisher College of Business in Columbus, wrote an article in the Harvard Business Review titled “We’re in this together” published in December 2004. The article describes a two-by-two matrix where complexity to supplier and volume of buy is the two axels. Let’s use this matrix to explain what Hoffman wants to achieve by the increased interaction with suppliers and buyers. When putting strengthen environmental goals and restriction on suppliers the complexity of relationship increases by adding a value not directly linked to price, delivery or product quality.

If an average complexity line is drawn into the matrix the motion of suppliers and buyers increased complexity will push them to the right, making more suppliers and buyers to end up as high-complexity relationships. Knemeyer and Lambert writes that those suppliers/buyers who end up in the top right corner should be consider as prioritized. It is suggested in the article that the company and its prioritized suppliers and buyers should engage a partnership. After evaluating the desire of partnership at respective company and with what ease they could coordinate activities, they can enter three types of partnership.

Type 1 – In which coordination is limited

Type 2 – In which activities of multiple divisions are integrated

Type 3 – In which each company views the other as an extension of itself

With this partnership model company can interact with its suppliers and buyers to achieve the environmentally goals stated through the supply chain. Since the use of LCA provides an overview of the supply chains emissions the supply chain perspective is suggested to meet the emission goals in an efficient way.

Published the same month in the same Harvard Business Review is an article by Jeffrey K. Liker and Thomas Y. Choi professors at University of Michigan respective W.P Carey School of Business at Arizona State University. They introduce the Japanese expression “supplier keiretsu”, which basically is a “close-knit networks of vendors that continuously learn, improve, and prosper along with their parent companies”. In other words; building strong relationships with suppliers and buyers through engaging them into the company’s daily operations. Liker and Choi manage to show proof of the benefits of supplier keiretsu on eight different points. The most important conclusion about keiretsu is that a long term interaction with suppliers and buyers can increase productivity, improve quality and reduce costs along the suppliers. A good deal for Honda who is taking 50% of the cost savings.

Thursday, February 28, 2008

Good environmental standard doesn’t equal climate confidence

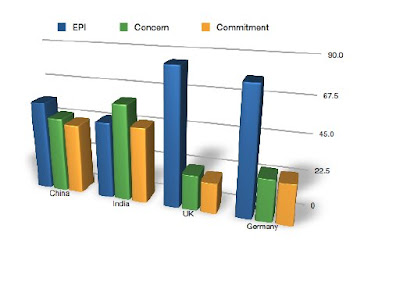
The Hongkong and Shanghai Banking Corporation (HSBC) has performed a large survey among common people (9000 respondents in 9 countries on 4 continents) in collaboration with The Climate group, Earthwatch, The Smithsonian and WWF in order to create a climate confidence index. The survey covers four areas; peoples concern in climate change, the confidence in solving the problem with climate change, the commitment to reduce climate change and finally the optimism in solving the issue with changing climate. When combining the result from HSBC’s survey with the Environmental Performance Index (EPI) from Yale University we found some really interesting aspects.

The figure shows concern, confidence, commitment and optimism regarding climate change and EPI in the same diagram. Source: HSBC & Yale University

The figure shows data from HSBC’s survey and EPI plotted on the countries, the darker brown the better result in EPI and customer confidence index in a decreasing scale.

When comparing two developed countries (United Kingdom and Germany) with two emerging countries (China and India) in terms of EPI, climate change concern and climate change commitment, the result is clear; China and India are performing poor EPI but has a large concern about the climate change and in contrast, United Kingdom and Germany is both scoring high EPI but climate change is not bothering them in the same extent as in China and India.

Another key finding from HSBC’s survey is to which extent a customer is willing to go in order of saving the environment.

A bird view on the market's fullness

As presented yesterday, different markets/countries seem to follow the idealized product life cycle curve in terms of paper consumption per capita. The darker brown in the global plot above, the further has the country successed in the stages of the product life cycle.

Wednesday, February 27, 2008

Global paper consumption in a product life cycle perspective

A country’s paper consumption is depending on the country’s GDP, and so is the “Environmental Performance Index”, EPI, produces at Yale Center of Environmental Law and Policy, Yale University. When paper consumption and EPI is plot together as a function of GDP the connection is obvious. The plot is done for the 96 countries where Stora Enso has a sales office and where data is available, leaving 30 countries out.

But just as any product the paper consumption should grow through all the different stages in the product lifecycle curve. When plot the top thirteen paper consumption countries the trend id clear.

According to the plot of paper consumption in the top thirteen countries in the interval of 1961 to 2005 there is a trend of decreasing paper consumption after the year 2000. The top thirteen paper consumption average below clearly shows what is happening. The average GDP increases constantly even though we earlier showed the linkage between GDP and paper consumption. It there for seems like the different markets don’t just get full, they tend to shrimp.


The thesis of paper consumption following the stages of the product life cycle curve seems to be useful in order to measure how a curtain market is affected by climate change. Because a market’s fullness in combination with how it is performing environmentally and the customer’s climate confidence could be a way of evaluating the climate change affection a certain market.

If the idealized product life cycle curve shown above is used to plot all the different sales offices according to the last twenty years paper consumption a clear view of the market situation in terms of product life cycle is reveled.

In order to plot the different countries/markets indexes has been used. Countries above the “idealized life line” have higher paper consumption per GDP than average, and those below the line therefore have lower paper consumption per GDP than average. Countries with the lowest GDP are generally found in the developing phase.

Wednesday, February 20, 2008

Expertise

Mr Robert Repetto, legendary professor in the practice of economics and sustainable development, and co-author of “An analytical tool for managing environmental risks strategically”, helps out with the thesis approach.


Sustainable Packaging Coalition Survey

Per&Per has done a survey along the 160 members of the Sustainable Packaging Coalition in order to investigate the underlying reasons for such a percipience and also the members allocation. It was founded that only 28% of the members where business to consumer companies and 83% where is some way selling packaging or packaging solutions, 2% where either governmental bodies or schools. The most interesting part of the survey is when analyzing the different business to consumer companies, fifty percent of those where represented by food and beverage including fast food companies.

When analyzing the B2C companies we took economic volume, ownership and allocation in to consideration. This approach divided the B2C companies into two slightly different groups. The first and biggest group, represented by two third of the total amount of B2C companies where selling for more than 2 billion USD per year, and all of them are selling on a global market. The second group consists of smaller companies all privately owned selling environmental niche products to developed countries; none of them, selling for more than 1 billion UDS per year.

A continuance of the analysis of the big selling B2C companies will show their reasons for putting effort and money into the Packaging Coalition, hopefully revealing the risks and opportunities in consumer paper board. For example McDonalds is one of the huge B2C companies in the coalition and them states in their sustainability rapport that they have failed in finding enough sustainable packaging. The survey results are to be continued, enjoy.

Monday, February 18, 2008

Saturday in Southport

Per and Per performs an interview with the CFO for Iggesund Paperboard, Una Lausen, in USA during the Saturday. Some great inputs for the master thesis and a glint of the beautiful Southport are the result.

Thursday, February 14, 2008

Old fashion management


In Sweden we teach our kids their first management tool when they are around 10 years old, brainstorming, a way of turning chaos into order, at least that’s the intention. However, thank to some modern organization theorists we can now arrange the brainstorming more structured. In her book named “Organization Theory”, Mary Jo Hatch introduces the PEST method. PEST is an abbreviation for Political/Legal, Economic, Social/Cultural and Technology.

Let’s use those sectors in order to find parameters that will have influence on business due to global warming. For example political decisions will lead to smaller amount of carbon dioxide emissions in a certain region, making the prize to rise, affecting the marginal costs for companies. So we therefore put the PEST on the y-axel (see picture above) and try to weight the parameters against each other with some kind of failure mode and effect analysis on the x-axel, the shortening for the failure mode and effect analysis is FMEA. But let’s also try to find opportunities instead of just the failure mode. In the picture above we named the columns opportunities, threats (the failure) and also adding a column for the sum of how detectable, sever and the accuracy of the threat or opportunity. How the columns are to be ranked we leave for further research and instead focus on why to do this.

As explained in the previous post, “WRIs green success recipe”, a company can’t just focus on their own operations it must also consider other risks in its surroundings. Let’s use the forest product company Weyerhaeuser again to explain that environmental related risks exists also outside the mills. For example climate change might have physical effect on its main raw material, trees, such as greater damage by wood beetles because of milder winters. So in the model introduced below “increasing damage on wood due to beetles” could be put in as a threat and then the severity, possibility and rate of determination ranked afterwards.

We have also added a column of geography so that the risk or opportunity could be spread on the affected regions. We will get back to this later and also arguing pros and cons with the model. We are also aware of other existing models that are very alike the one above and will introduce those as soon as our research allows. But until then, enjoy some old fashion management in order to assess carbon related risks and opportunities.

WRIs green success recipe

The four steps above is according to the World Resources Institute (WRI) the way of succeeding on gaining competitive advantages on a warming planet which where published in Harvard Business Review last March under that title, competitive advantages on a warming planet. The authors are the President and a financial analyst at WRI, Jonathan Lash and Fred Wellington.

The first step is about getting to know your carbon footprint; you can’t manage if you don’t measure. And quantifying the carbon footprint also makes great sense if you’re an actor on a carbon market, like in Europe. One method for such quantifying is the Greenhouse gas Protocol (GHG), developed with the World Business Council for Sustainable Development (WBCSD) where different scopes provide measurable goals for carbon emissions. There are some other different tools, the International Standards Organization (ISO) is one and that has led to some more industry specific tools e.g. the International Council of Forest and Paper Associations.

The second step is about getting a grip of the carbon related risks and opportunities. The article make a great example of the forest products company Weyerhaeuser which have set very ambitious goals for its mills but should also consider other risks and opportunities along the supply chain as well as political, social and physical.

The third step makes company exposure to carbon related risks an issue to decrease and also states that the company must seize the opportunities to remain competitively. To summaries this step it is more of how to manage the two steps before. As stated earlier, you can’t manage if you don’t measure.

The great conclusion pretty much speaks for it own. The fourth step states that you have to do it better than rivals in order to get those competitive advantages on a warming planet.

Wednesday, February 13, 2008

Good news for green-wave riders

IWAY - The green way

According to the book “Green to Gold” IKEA is arguably the most sustainable company in the world. A great reason for that is realized when reading there sustainability rapport. Approximately a third of the editorial text in the sustainability rapport is written by four different NGOs that are covering the interests of nature, animals, and children well being. And not enough with that the different organization gets to write in the rapport, they are aloud to pay criticism against IKEA as well. For example Greenpeace thinks that IKEA are moving to slow and should support its wood suppliers in a better way and WWF thinks that IKEA should let the customer be more involved in showing which green way to go.

IKEA also states in their rapport that NGOs are very important stakeholders and often refers to the relationship with NGOs as “dialogues and partnerships”. ”The IKEA Way on Purchasing Home Furnishing Products” (IWAY) defines what suppliers can expect from IKEA and what IKEA requires from its suppliers in terms of legal requirements, working conditions, child labor, environment and forestry management.

What is for sure is that IKEA in a very successful way has managed to use their flat packaging and sourcing of the assembling to customer to argue for their environmental awareness but IKEA is also taking pole position when it comes to build strong bands with NGOs.

Green strategy, a part of PPM

The bondery between different parts of the environmental strategy and how they end up as a mean of control for managing the product portfolio.

BP - Beyond Petroleum

After launching an internal trading system for carbon dioxide and methane in 2000, British Petroleum discovered not just 1.5 billion dollars in efficiency savings but they also got a great influence in the creation of the United Kingdom’s trading system. So being a step ahead of the green wave BP got a seat at the table, as their CEO John Browne puts it.

“One of the steps we’ve taken is to set up a trading system within the company to ensure we cut emissions in the most cost effective way possible.” - Former CEO Lord Browne

The cornerstone of a successful emissions trading programme is having a robust and credible system in place to measure, and where appropriate, verify the greenhouse gas data being used in the trading system. Each business unit (BU) is responsible for measuring or calculating its emissions. Standard reporting protocols for carbon dioxide (CO2) and methane (CH4) have been used by the BU's to collect and report emissions data.

The emissions of the different BUs varied a lot, in fact the 20/80 rule where almost usable since 40 of the 150 business units correspond for 80 percent of the emissions, but no matter emission every unit where eligible to participate in the trading system. The cap and trade system where controlled centrally and the cap was set for BP as whole but if a BU needed more emission permits they where to buy them themselves. To provide a flow overview each allowance where given a serial number to make it traceable.

Other advantages with the cap and trade system are that it provides the different BUs with both flexibility and more precise calculations when it comes to investments in abatement technology due to the prizing of emissions. Also, under a cap and trade system there is greater certainty that prescribed targets will be achieved since there are a determined finite number of allowances allocated.

Understanding the cost of abatement on a project-by-project level is vital for BUs to engage in emissions trading. Guidelines for calculation methodology and assumptions have been developed for BUs to maintain some consistency in the approach. It was each individual BUs responsibility to identify and know its cost of abatement. A database of greenhouse gas abatement projects was constructed to share ideas on cost effective options throughout the BP group.

BP was the first in the world with such an internal trading system which not only saved them a lot of money and gave them influence on other trading systems, it also brought out the green thinking throughout the entire organization, making local affords pay of globally.

Tuesday, February 12, 2008

The star of green-wave riders, Patagonia

http://www.patagonia.com/web/us/footprint/index.jsp

GE gets it right

Boxing environmentalists

The famous Swedish boxer Ingemar Johansson used a tactic where he stayed so close to his competitor so that they weren’t able to hit him. This tactic where put into words by Sun Tzu for over 2500 years ago and also used by the former dictator of Zaire, Mobutu Sese Seko, “keep your friends close but your enemy closer”. What that says about the close friendship Mr Mobuto had with Ronald Reagan we leave for now and instead focus on how this tactic could be used in environmental strategy.

The story told in Harvard Business Review in May 1991 can serve as a good example. The article is about an American paper producer establishing both an eucalyptus plant age and paper mill in the Asian region. The young professional responsible for the set up was convinced to do it properly without any bribery. He makes personal relationship with the government and then turns to Pellona, a consortium of more than 100 environmental and community groups in order to gain their faith. Since the paper producing company suffers from a reputation of being insensitive the reaction from Pellona was clear.

“Because he worked for that company, we drew the obvious conclusion: the young man wasn’t true about his obligations in environment issues and the local communities.”

Among the NGO (non-governmental organization) Pellona where some militant organizations that opposed all further forest exploitation and now threatening the entire establishment through using its global network to vilify and thereby serious damaging the paper company’s branding. A branding including great investments in new technology decreasing emissions both to air and water as well as investments in making the processes more energy efficient. More resources where then needed to rescue the establishment in Asia and the branding globally. Convincing NGOs and building relationship is a process that might take a while to pay of when industries launch their going-green strategy. In this case the young professional also had to convince the top management that resources spent on relationship building local would pay of global.

This is just one example of how important the relationship with NGOs is since they in many times serves as a link between a company and its customer also having a great influence on media. So while having the boxer Mr Johansson’s tactic in mind we should also consider investment guru Warren Buffet’s vice words on branding.

“It takes twenty year to build a reputation and five minutes to ruin it”

Monday, February 11, 2008

Feelings are facts

Understanding customers need and demand is crucial for a successful environmental product differentiating. An example of the opposite was when StarKist in 1990 introduced “dolphin-safe” tuna captured in regions where the tuna doesn’t swim below the dolphins and making the dolphins unintentionally victims for the basketlike nets dropped in the sea to reach the tuna. StarKist failed on three conditions necessary for a successful differentiating. First they over estimated the customers will to pay more for the “dolphin-safe” tuna. Second, for each saved dolphin a dozen of sharks, turtles and other marine animals fell victims for the nets, leaving them and the environmentally advantages dead. And the final condition where StarKist failed where that they had no protection against imitators leaving StarKist without return on the environmental investment. So depending upon market situation (push or pull) this leads to three conditions which need to be fulfilled in order to return investment for an environmental product differentiating

• Identify customer or market willing to pay extra for an environmentally friendly product
• The environmental advantages must be able to communicate to customer
• The protection against imitators is good enough to profit the investment

Some kind of failure mode analysis of the risks with such a product differentiating could be difficult to perform since it touches many intangibles but is helpful both in identifying potential customer and when comparing competitors. Some of those intangibles could be customer loyalty and what that is worth and the employee morale. Hard to put numbers on such parameters but feelings are probably facts.

Friday, February 8, 2008

A coin has two sides

Warmly welcome to Per&Per’s master thesis blog. The intention with this blog is to keep all the different stakeholders within in this thesis updated in the work progress. First of all we would like to take this opportunity to thank all the persons involved in making this thesis appointment possible.

The thesis topic is Sustainable Product Portfolio where carbon dioxide will be evaluated as a mean of control. The thesis will be written during the spring semester of 2008 at Yale University’s School of Forestry and Environmental Studies and The Royal Institute of Technology’s department for Industrial Ecology.

According to highly regarded business strategist Michel Porter a business strategy model can gain advantages to a company through lowering cost or differentiating products. The two different perspectives of the eco-advantages gained through operating with carbon dioxide as a mean of control will be handled within this thesis. The beneficial use of a environmental strategy could the famous oil company BP witness about when they used carbon dioxide as a way of making their business more environmental efficient. After introducing the “looking for carbon” where top management where dedicated to reduce greenhouse gases and especially carbon dioxide BP returned 1.5 billion dollar on their process investments on 20 million dollar.

“Environmental strategy is about seizing competitive advantages through strategic management of environmental challenges.”

Also stated in the book “Green to Gold” by Daniel C. Esty and Andrew S. Winston is that Stora Enso is among the top ten international green wave-riders and is there for the highest listed pulp and paper producing company in the world.

Please feel free to come with feedback or any suggestions of any kind. The blog will be frequently updated and shorter posts added under the thesis topic. We hope that you will enjoy and learn a lot about environmental strategies.