Friday, March 7, 2008

The Geography Behind Climate Change


The figure is showing representative countries for StoraEnso's sales market. 15000 individuals responded to the question; “have you personally done anything to reduce the usage of packaging and bags”


How climate change affects end customers varies from country to country. By studying surveys from HSBC, Accenture, BBC and McKinsey we found that there is some countries and continents that are more representative for the emerging changes in end customer demand and behavior. The map below shows countries that are leading the green wave and are strategic key markets for StoraEnso, like Russia, India, Brazil and China. These countries are further interesting due to the supply of low cost and fast growing fiber. A key finding is that these countries are showing a considerable environmental awareness compared to more developed countries.


The figure is showing representative countries for the StoraEnsos sales market. 15000 responded to
the question; “are you buying any green products?”


Tuesday, March 4, 2008

Are we all on the same track?

The McKinsey survey "How companies think about climate change" shows result that are very similar to the HSBC survey "Climate Confidence Index 2007" with one big deferens, it’s not the peoples opinion it’s the CEO’s opinion. Accenture’s survey "A new consumer mindset" also confirms the similarities and so dose the Landors annually "ImagePower" survey.

Similarity One
Growing GDP equals Growing climate awareness

McKinsey survey: “Role of climate change in overall corporate strategy considered very, somewhat important”

Accenture and HSBC found the same result; the most concerned and active countries are the merging as India, China and Brazil. The least concerned in HSBC and Accenture survey is United Kingdom and North America.

Similarity two
It’s changing and that’s rapidly

McKinsey survey: “How often does your company currently take climate change into consideration?”

65% answered - Managing corporate reputation, brands

Landor's "ImagePower" survey shows similar and very interesting result; in the 2006’s survey they found that green thinking was a minority concern and that few could name “a green brand”. But in the 2007’s survey they record a striking change, a united green concern through out their answers.

Environmental "Supplier Keiretsu"

Keiretsu is another Japanese expression to put on the list of production vocabulary influenced by Toyota and Honda. The reason for another tongue wrecking Japanese word is the success for Japanese enterprises to built strong relationships with its suppliers. But first some about why strong relationship could be useful when launching corporate carbon strategies.

Hoffman tells an eight-step-story in his book “Carbon Strategies” where a supply chain perspective is very important in order to assess a company’s risks and opportunities with climate change. Hoffman states that interaction with suppliers and buyers are important to increase the value chain’s environmental performances. Michael Knemeyer and Douglas M. Lambert, both working at Ohio State University’s Fisher College of Business in Columbus, wrote an article in the Harvard Business Review titled “We’re in this together” published in December 2004. The article describes a two-by-two matrix where complexity to supplier and volume of buy is the two axels. Let’s use this matrix to explain what Hoffman wants to achieve by the increased interaction with suppliers and buyers. When putting strengthen environmental goals and restriction on suppliers the complexity of relationship increases by adding a value not directly linked to price, delivery or product quality.

If an average complexity line is drawn into the matrix the motion of suppliers and buyers increased complexity will push them to the right, making more suppliers and buyers to end up as high-complexity relationships. Knemeyer and Lambert writes that those suppliers/buyers who end up in the top right corner should be consider as prioritized. It is suggested in the article that the company and its prioritized suppliers and buyers should engage a partnership. After evaluating the desire of partnership at respective company and with what ease they could coordinate activities, they can enter three types of partnership.

Type 1 – In which coordination is limited

Type 2 – In which activities of multiple divisions are integrated

Type 3 – In which each company views the other as an extension of itself

With this partnership model company can interact with its suppliers and buyers to achieve the environmentally goals stated through the supply chain. Since the use of LCA provides an overview of the supply chains emissions the supply chain perspective is suggested to meet the emission goals in an efficient way.

Published the same month in the same Harvard Business Review is an article by Jeffrey K. Liker and Thomas Y. Choi professors at University of Michigan respective W.P Carey School of Business at Arizona State University. They introduce the Japanese expression “supplier keiretsu”, which basically is a “close-knit networks of vendors that continuously learn, improve, and prosper along with their parent companies”. In other words; building strong relationships with suppliers and buyers through engaging them into the company’s daily operations. Liker and Choi manage to show proof of the benefits of supplier keiretsu on eight different points. The most important conclusion about keiretsu is that a long term interaction with suppliers and buyers can increase productivity, improve quality and reduce costs along the suppliers. A good deal for Honda who is taking 50% of the cost savings.

Thursday, February 28, 2008

Good environmental standard doesn’t equal climate confidence

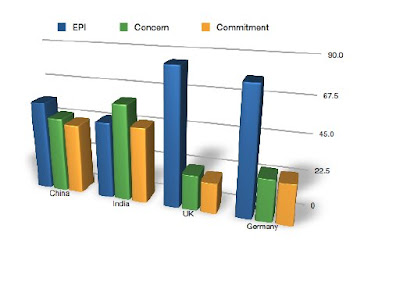
The Hongkong and Shanghai Banking Corporation (HSBC) has performed a large survey among common people (9000 respondents in 9 countries on 4 continents) in collaboration with The Climate group, Earthwatch, The Smithsonian and WWF in order to create a climate confidence index. The survey covers four areas; peoples concern in climate change, the confidence in solving the problem with climate change, the commitment to reduce climate change and finally the optimism in solving the issue with changing climate. When combining the result from HSBC’s survey with the Environmental Performance Index (EPI) from Yale University we found some really interesting aspects.

The figure shows concern, confidence, commitment and optimism regarding climate change and EPI in the same diagram. Source: HSBC & Yale University

The figure shows data from HSBC’s survey and EPI plotted on the countries, the darker brown the better result in EPI and customer confidence index in a decreasing scale.

When comparing two developed countries (United Kingdom and Germany) with two emerging countries (China and India) in terms of EPI, climate change concern and climate change commitment, the result is clear; China and India are performing poor EPI but has a large concern about the climate change and in contrast, United Kingdom and Germany is both scoring high EPI but climate change is not bothering them in the same extent as in China and India.

Another key finding from HSBC’s survey is to which extent a customer is willing to go in order of saving the environment.

A bird view on the market's fullness

As presented yesterday, different markets/countries seem to follow the idealized product life cycle curve in terms of paper consumption per capita. The darker brown in the global plot above, the further has the country successed in the stages of the product life cycle.

Wednesday, February 27, 2008

Global paper consumption in a product life cycle perspective

A country’s paper consumption is depending on the country’s GDP, and so is the “Environmental Performance Index”, EPI, produces at Yale Center of Environmental Law and Policy, Yale University. When paper consumption and EPI is plot together as a function of GDP the connection is obvious. The plot is done for the 96 countries where Stora Enso has a sales office and where data is available, leaving 30 countries out.

But just as any product the paper consumption should grow through all the different stages in the product lifecycle curve. When plot the top thirteen paper consumption countries the trend id clear.

According to the plot of paper consumption in the top thirteen countries in the interval of 1961 to 2005 there is a trend of decreasing paper consumption after the year 2000. The top thirteen paper consumption average below clearly shows what is happening. The average GDP increases constantly even though we earlier showed the linkage between GDP and paper consumption. It there for seems like the different markets don’t just get full, they tend to shrimp.


The thesis of paper consumption following the stages of the product life cycle curve seems to be useful in order to measure how a curtain market is affected by climate change. Because a market’s fullness in combination with how it is performing environmentally and the customer’s climate confidence could be a way of evaluating the climate change affection a certain market.

If the idealized product life cycle curve shown above is used to plot all the different sales offices according to the last twenty years paper consumption a clear view of the market situation in terms of product life cycle is reveled.

In order to plot the different countries/markets indexes has been used. Countries above the “idealized life line” have higher paper consumption per GDP than average, and those below the line therefore have lower paper consumption per GDP than average. Countries with the lowest GDP are generally found in the developing phase.

Wednesday, February 20, 2008

Expertise

Mr Robert Repetto, legendary professor in the practice of economics and sustainable development, and co-author of “An analytical tool for managing environmental risks strategically”, helps out with the thesis approach.